
Introduction
The identification of subvisible particulate matter (PM) has been an area where spectroscopic (IR and Raman) microscopy has made major inroads in expanding scientific knowledge. For example, the study of microplastics1 has advanced with the application of spectroscopic methods like direct IR (FTIR and Quantum Cascade Laser (QCL)) and Raman microscopy, despite both direct IR and Raman suffering from a range of limitations. Though such techniques have been widely employed, aggregated proteinaceous matter, as seen in formulated protein therapeutics, is a hugely challenging application where these direct IR techniques and dispersive Raman systems fall short, especially for particulates less than 10 µm in size. These aggregates present challenges to drug delivery, efficacy, quality, and safety2,3, and require novel tools for complete characterization.
Optical Photothermal Infrared Spectroscopy (O-PTIR) is a novel technique for characterizing PM at sizes (<10µm) previously difficult to interrogate. O-PTIR is a pump-probe spectroscopic technique, where a pulsed, broadly-tunable infrared pump laser (QCL) excites a sample, which is then probed by a second visible probe laser (typically 532nm or 785nm). Absorption of the IR laser, corresponding to vibrational transitions in the sample material, result in a small modulated change in the temperature of the sample. This modulation in temperature results in a concomitant change in the refractive index of the material, together with subtle surface expansion, altering the reflected probe beam intensity. Measurement of the reflected probe beam intensity as a function of IR pump laser spectral wavenumber sweeping, thus provides what is essentially a pure spectrum of the IR transitions (absorptions) within the sample. The net effect is measuring an IR spectrum in reflection mode that is free of optical effects such as density, particle shape or size dispersive scattering artifacts, or wavelength-dependent penetration depth of direct IR techniques such as FTIR-ATR/QCL. Despite being collected in reflection mode, O-PTIR spectra resemble those collected with FTIR transmission or ATR and are thus compatible with existing custom or commercial FTIR spectra libraries, without any further need for processing or conversions. Additionally, by virtue of the probe beam Raman spectra may be concurrently collected from the sample (the same spot at the same time, with the same resolution), providing an orthogonal vibrational spectroscopic fingerprint of the sample.
Optically, the resolution of O-PTIR is determined by the visible probe beam, which can be focused tightly relative to the IR pump beam. This results in IR spatial resolution capabilities of ~500 nm, a massive 20-30x improvement over the 10-15 µm spatial resolution of direct IR (FTIR/QCL) systems, opening an experimental window in the subvisible extending into the submicron. The following examples prove O-PTIR capable of providing valuable information for biologic samples, where low signal strength has hobbled traditional dispersive Raman.
Workflow
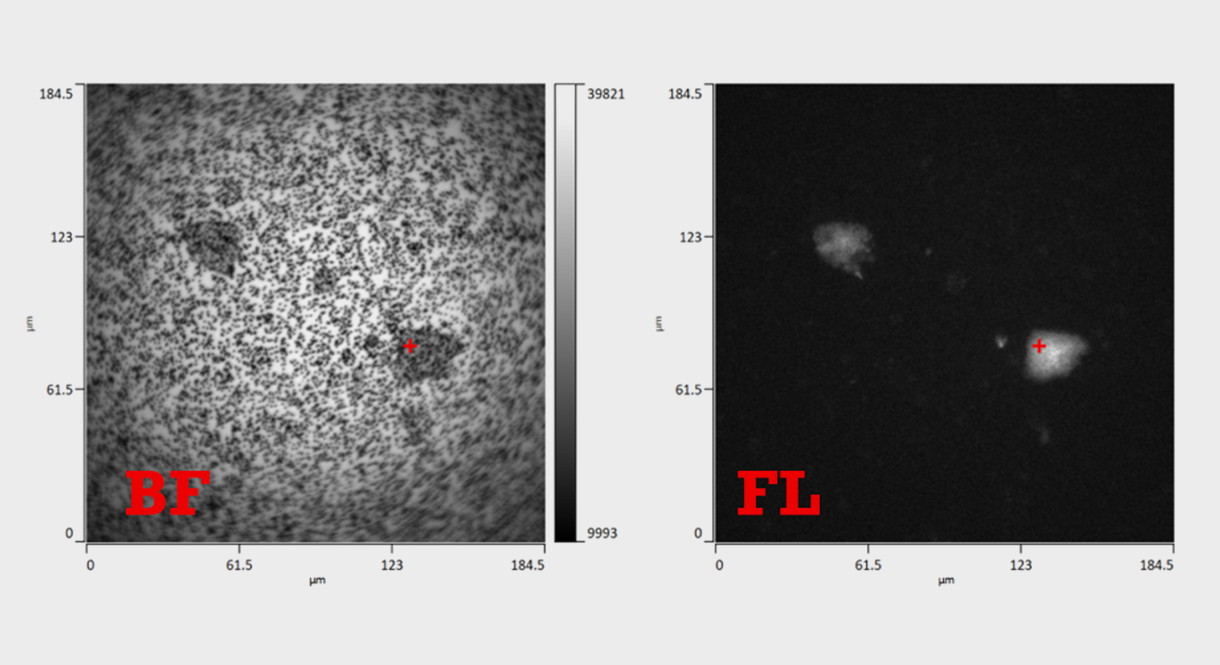
The mirage O-PTIR workflow is similar to existing spectroscopic microscopy platforms. Sample presentation to the mIRage O-PTIR microscope can be on a membrane filter, porous silicon, glassy substrate, or other common preparation. Particulates are localized using either brightfield optical microscopy or fluorescence microscopy (the same microscope and objectives), combined with image analysis tools to provide size and morphology. These particulates may then be characterized using O-PTIR, Raman, or a combination of the two techniques to provide an orthogonal chemical dimension for a complete particle profile, all using the same single optic. Alternatively, with a priori knowledge of the spectroscopic characteristics of the sample, single-frequency targeted chemical images may be used to isolate domains of specific chemistries for image analysis. O-PTIR and Raman spectra may both be directly exported in Wiley KnowItAll for comparison to reference libraries, or a custom library built to user requirements.
Materials and Methods
The sample system consisted of a monoclonal antibody (mAb) formulation (15 mg/mL, pH 6.2, sucrose, PS80) freshly prepared. An exchange buffer mimicking the formulation buffer was created without the sucrose excipient to protect the mAb from hydrophobic region aggregation4. The exchange buffer was triple-filtered with a Stericup 0.22 µm bulk filter prior to buffer exchanging five times using a Beckman centrifuge at 4 kg with Millipore 50 kDa cutoff centrifuge filter. The resulting destabilized formulation was filled into 10R vials and capped with elastomer closures for storage. The formulation was stored at 2-8 °C for one month to produce subvisible proteinaceous aggregates. Preparation of the sample consisted of filtering 1 mL onto a gold-coated polycarbonate membrane (25 mm diameter, 0.8 µm pores) with five 1 mL washes using triple-filtered deionized water to remove water-soluble excipients.
Experiments were conducted on a mIRage-LS Multimodal O-PTIR system (IR/Raman/Fluorescence). Data acquisition was conducted using the 40x, 0.78NA Cassegrain multi-modal objective for both brightfield and fluorescence imaging, as well as O-PTIR and Raman spectra. All data was acquired in copropagating mode (IR and probe delivered from the top) with reflection detection using the standard Si photodiode detector. The QCL was dual-range (CH-FP), delivering spectral coverage from ~3000-2700 and 1800-970 cm-1. Fluorescence images (epi widefield) were collected using an autofluorescence cube (365 nm center, 20 nm width excitation and 460 nm long pass emission) Single O-PTIR spectra were collected at with a spectral resolution of 8 cm-1 using ~5 mW of 532 nm probe, resulting in a single particle collection time of 5-10 seconds. Single-frequency O-PTIR images were collected at 100nm pixel size with a total collection time of ~2 mins per IR wavenumber. O-PTIR spectra were normalized to a feature of interest, with no additional preprocessing. All Raman spectra were collected simultaneously using a 600 lines/mm grating to deliver a spectral range of 4200-470 cm-1 at ~4 cm-1 spectral resolution, with 1 sec exposure and 20 accumulations.
Particulate Localization and Morphology
he prepared filter was mounted on a glass slide without further manipulation. A region of high particulate density was manually selected and imaged using the 40X Cassegrain objective. Brightfield and autofluorescence images were collected, with the autofluorescence images used (as these provided for better particle detection and contrast) for feature selection using featurefindIR™ to provide particulate location, size, and morphology.
O-PTIR Characterization of Particulates
The particle size distribution of the particles within the image shows every particle is smaller than 10 µm. Six particulates from the polysaccharide-free formulation were randomly selected for O-PTIR characterization, as indicated by the colored circles. Simultaneous full-range IR and Raman spectra were collected for each particulate.
The resulting IR spectra are of very high S/N, including for particles as small as 1 µm in size, despite each scan taking seconds to collect. Each spectrum displays the typical hallmarks of proteinaceous species, including the Amide I (1650 cm-1) and Amide II (1550 cm-1) bands, and structure in the CH-stretch region. Differences in the shape of the Amide I also indicate likely differences in protein secondary structure between these particles. Interestingly, the two largest particulates have an additional feature at 1040 cm-1 and contain no appreciable band in the CH-stretch region. This indicates the presence of a second chemistry in these particulates that does not appear to be silicone oil. It is unclear what the second component is in these particles. Raman spectra are distinctly lower in S/N, which is typical for Raman of particles smaller than 10 µm. All Raman spectra displayed a moderate fluorescence background, on top of which some organic bands are observable, but the combination of poor S/N and the broad fluorescence background do not allow for further chemical interpretation.
The infrared band structure observed in the spectra collected of these particles inform additional experiments, including single-frequency IR chemical images (maps) of individual particles. In this vein, two sub-5 µm, close-lying particles were selected for high-spatial resolution chemical imaging. Here, full-range O-PTIR spectra are collected of the particles, with a red and a blue circle to denote which spectra belong to which particle. The O-PTIR spectra are similar, with some structuring in the Amide region, while the CH-stretch region shows differences in intensity between the particles. As a single FTIR spectrum over this area would average all of the material within the circle, the subtle chemical differences between these two ~5 µm particles would be missed.
To further investigate these particles single frequency IR chemical images were collected at 1589, 1660, and 2957 cm-1. These regions correspond to a featureless region (dip between amide I and amide II), the maximum of the Amide I band, and a peak in the CH-stretch region respectively. As O-PTIR spectra require no spectral correction, ratios of the intensities can be directly calculated to display discrete chemical information.
For example, the ratio of the Amide I maximum to the featureless region clearly shows the location and distribution of the proteinaceous particles. Likewise, a map of the CH-stretch region to the Amide I maximum should show consistent color for identical chemistries. However, it is noted that the particle has a lower amount of the CH-stretch (relative to Amide I) than that seen in the red particle. The results suggest that both particles consist of aggregated protein, but that the blue particle has some chemical difference from pure protein.
Conclusions
O-PTIR is a novel tool for the characterization of subvisible particles, such as the proteinaceous aggregates investigated here. Not only is O-PTIR capable of locating micron-scale particles on a heterogeneous substrate using autofluorescence detection, it also produces high-quality O-PTIR spectra of said particles in only a few seconds. O-PTIR thus overcomes both fluorescence interference and poor S/N of traditional high-spatial resolution methods such Raman microscopy. This capability of O-PTIR can be expanded into chemical imaging experiments to visualize the heterogeneity within a single particle, or chemical imaging a larger area to locate a specific chemistry within a few minutes. O-PTIR significantly expands the capabilities of any laboratory studying subvisible particles beyond even dispersive Raman.
References
- Dong, M., She, Z., Xiong, X., Ouyang, G., & Luo, Z. (2022). Automated Analysis of Microplastics Based on Vibrational Spectroscopy: Are We Measuring the Same Metrics? Analytical and Bioanalytical Chemistry, 3359-3372. doi:https://doi.org/10.1007/s00216-022-03951-6
- Roberts, C. J. (2014). Protein Aggregation and its Impact on Product Quality. Current Opinion in Biotechnology, 30, 211-217. doi:https://doi.org/10.1016/j.copbio.2014.08.001
- Rosenberg, A. S. (2006). Effects of Protein Aggregates: An Immunologic Perspective. AAPS Journal, 8. doi:https://doi.org/10.1208/aapsj080359
- Timasheff, S. N. (1998). Control of protein stability and reactions by weakly interacting cosolvents: the simplicity of the complicated. Adv. Protein Chem, 51(51), 355-432.
Authors:
Kevin Dahl Ph.D., Founder and Lead Consultant
Particlese LLC
Dr. Mustafa Kansiz, Director of Product Management
Photothermal Spectroscopy Corp.
