
Introduction
Characterization of particulate matter (PM) has been, and remains, a considerable challenge for scientists working in a range of industries. Small-molecule pharmaceuticals1, biopharmacueticals2, semiconductors, and microplastics3 all present contamination, chemistry, and instability problems for particulates below 20µm in size, where collection of high-quality spectroscopic data can be very challenging. Access to chemically-specific information on this size scale has potential to improve understanding of kinetic, process, product formulation stability and safety/efficacy and environmental outcomes. Novel tools are needed to push modern laboratory capabilities to higher sensitivity and smaller particulate size.
Optical Photothermal Infrared Spectroscopy (O-PTIR)4 is a novel technique for chemically characterizing PM at size scales down to submicron, even sub-500 nm – previously difficult to interrogate. O-PTIR is a pump-probe spectroscopic technique, where an infrared pump laser thermally excites a sample, which is then probed by a visible probe laser. Absorption of the IR laser, corresponding to vibrational transitions in the sample material, result in a subtle change in the temperature of the sample. This change in temperature results in a concomitant change in the refractive index of the material and sample expansion, changing the probe beam intensity. Measurement of the probe beam intensity as a function of IR wavelength tuning thus provides essentially pure IR absorbance spectrum comparable and compatible with existing FTIR transmission or ATR spectra. The net effect is measuring an IR spectrum that is free of optical effects such as density or the wavelength dependence of IR techniques such as ATR. Additionally, Raman scatter may be concurrently collected from the sample, providing an orthogonal vibrational spectroscopic fingerprint of the sample.
Optically, the resolution of O-PTIR is determined by the visible probe beam, which can be focused tightly relative to the IR pump beam. This results in spatial resolution capabilities of ~500nm, a massive 30x improvement over the 10-15 µm spatial resolution of FTIR systems, opening an experimental window in the subvisible extending into the submicron. The following examples prove O-PTIR capable of providing valuable information for biologic samples, where low signal strength has hobbled traditional dispersive Raman.
Workflow
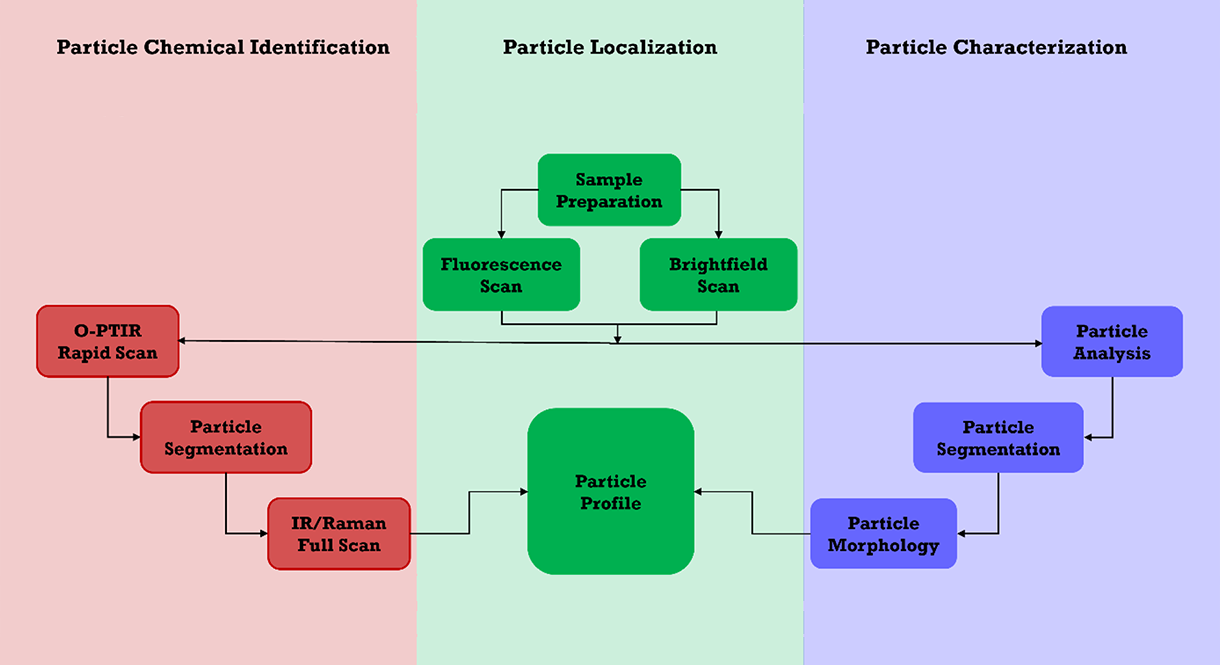
The workflow using the Mirage O-PTIR system is as straightforward as it is easy, as illustrated in the image above.
A sample is prepared, typically on a reflective membrane filter (Au coated polycarbonate or porous Si), to filter and immobilize the particulates. Depending on contrast requirements, brightfield optical microscopy or fluorescence microscopy can be used to localize particulates. From here, particulate images can be automatically segregated using the “featurefindIR™” tool to generate particle statistic and to automate the data collection of O-PTIR, Raman, or both techniques. The particulate morphology, combined with the spectroscopic data, is then used to build a particle profile describing individual particulates or groups of particles within the sample. O-PTIR and Raman spectra may both be directly exported in Wiley KnowItAllTM for comparison to reference libraries, or a custom library built to user requirements.
Materials and Methods
A monoclonal antibody (mAb) formulated at 15 mg/mL (pH 6.2, sucrose, polysorbate 80 (PS80)) was used as a basis for sample creation. An exchange buffer mimicking the formulation buffer was created without the PS80 excipient to protect the mAb against interfacial or thermal stress. The exchange buffer was triple-filtered with a Stericup 0.22 µm bulk filter prior to buffer exchanging five times using a Beckman centrifuge at 4 kg with Millipore 50 kDa cutoff centrifuge filter. The resulting destabilized formulation was filled into 10R vials and capped with elastomer closures for storage. The formulation was spiked with hydrolyzed PS80 (1M NaOH for 48 hours neutralized with 1M acetic acid) and stored at 40 °C for one week. One mL of the sample was filtered onto a gold-coated polycarbonate membrane and washed five times with triple-filtered deionized water to remove water-soluble excipients.
Experiments were conducted on a Mirage-LSTM multimodal submicron O-PTIR system. Brightfield initial assessment of the samples was conducted using a 10X magnification objective, and the 40X Cassegrain reflective objective was used to collect brightfield and fluorescence images, and O-PTIR and Raman spectra. Fluorescence (autofluorescence) images were collected at 355-375 nm excitation, with a low-pass emission filter (>440 nm). Single O-PTIR spectra were collected at 8 cm-1 spectral resolution, resulting in a single particle collection time of a few seconds. Single-frequency O-PTIR collections were collected at 100 nm pixel sizes and tool a few minutes to collect. O-PTIR spectra were not preprocessed unless otherwise stated.
Particulate Localization and Morphology
Prepared filters were mounted on a glass slide without further manipulation. The preparation was manually observed for regions of high particulate density, and high-magnification optical and fluorescence images were collected using the 40X Cassegrain objective. The fluorescence images were analyzed using PTIR Studio v4.6 software to provide particulate location, size, and morphology.
O-PTIR Characterization of Polysorbate Degradants
A region containing multiple fluorescent particulates was selected for the prepared polysorbate degradant sample. The fluorescence image overlays the brightfield image in green. Two particulates were selected for study, one 25 µm in size and the other 5 µm in size. Full-range O-PTIR spectra were collected for each particulate.
Examination of the O-PTIR spectra shows well-defined proteinaceous (Amide I and II) structure with no changes to the secondary structure. However, two bands are evident in the yellow spectra for the 25 µm particulate at 1584 and 1467 cm-1. These bands dominate the spectrum (red) collected for the 5 µm particulate. A difference spectrum, where one of the blue, protein-only spectra, is subtracted from the spectrum of the 5 µm particulate was calculated and identified using Wiley KnowItAll as the lipid-like tail from the hydrolyzed PS80 (Figure 4 inset). Owing to the mixed spectra of these particulates, two-frequency IR chemical imaging of these particulates was conducted at 1585 (PS80 degradant) and 1642 cm-1 (Amide I), and a chemical map was constructed using the 1585/1642 cm-1 ratio.
The IR chemical map shows that the smaller particulate (circled in green) consists largely of PS80 degradant (~60%), while the larger particulate (circled in purple) is highly heterogeneous across the surface, with regions of high PS80 degradant (left side) and high protein (middle, right side). In real-world samples such heterogeneity could indicate the PS80 degradant particulates serving as nucleation sites for proteinaceous aggregation. This capability is in its ease and speed and high chemical spatial detail is unique to O-PTIR and is extremely valuable in root-cause-analysis and for accelerated stability samples where instabilities in the formulation are purposely exaggerated.
Conclusions
Multi-modal, correlative O-PTIR spectroscopy and chemical imaging provides a wealth of value, combining multiple contrast mechanisms (optical, fluorescence, IR) with two vibrational spectroscopic techniques (O-PTIR, Raman), all with submicron spatial resolution. This opens particulate application spaces below 20 µm that were difficult to access with high chemical specificity. The examples shown here illustrate the identification of proteinaceous aggregates down to 1 µm in size, a difficult application for dispersive Raman and an impossible one for FTIR or ATR. O-PTIR also enables the mapping of particulates with true submicron resolution, leading to detailed information regarding chemical heterogeneity within a single particle. O-PTIR is a natural extension to any laboratory using vibrational microspectroscopy on a regular basis.
References
- Gordon, K.C. and McGoverin, C.M., 2011. Raman mapping of pharmaceuticals. International journal of pharmaceutics, 417(1-2), pp.151-162. https://doi.org/10.1016/j.ijpharm.2010.12.030
- Cao, X., Wen, Z.Q., Vance, A. and Torraca, G., 2009. Raman microscopic applications in the biopharmaceutical industry: in situ identification of foreign particulates inside glass containers with aqueous formulated solutions. Applied spectroscopy, 63(7), pp.830-834. https://doi.org/10.1366/000370209788701026
- Dong, M., She, Z., Xiong, X., Ouyang, G. and Luo, Z., 2022. Automated analysis of microplastics based on vibrational spectroscopy: are we measuring the same metrics?. Analytical and bioanalytical chemistry, 414(11), pp.3359-3372. https://doi.org/10.1007/s00216-022-03951-6
- Craig B. Prater, Mustafa Kansiz; Ji-Xin Cheng, A tutorial on optical photothermal infrared (O-PTIR) microscopy, doi.org/10.1063/5.0219983
Authors
Kevin Dahl Ph.D., Founder and Lead Consultant
Particlese LLC
Dr. Mustafa Kansiz, Director of Product Management
Photothermal Spectroscopy Corp.
