
Application note
O-PTIR technology for nano- and microplastic detection in tissue: Submicron chemical identification in intact biological systems
A comprehensive analytical framework for investigating nanoplastic/microplastic accumulation, spatial distribution, and potential biological interactions in situ.
Microplastics detection in biological tissue
The detection and characterization of microplastics and nanoplastics within biological systems has become an emerging area of interest in environmental health, toxicology, and translational biomedical research. While established analytical methods can successfully identify many isolated microplastic particles collected from environmental samples, particularly in the larger (>10–20 μm) size range, the biologically relevant challenge is the detection and characterization of smaller microplastics and nanoplastics directly within intact tissues. In these environments, particle detection and chemical identification are complicated by particle size, tissue heterogeneity, spectral overlap, and the need to preserve spatial and biological context.
In tissue, polymer signals coexist with a complex biochemical background arising from proteins, lipids, nucleic acids, extracellular matrix components, and diverse cellular structures. As particle size decreases, particularly into the submicron range, spectral contributions from both the particle and surrounding tissue can become intertwined, resulting in mixed particle–tissue spectra that are more difficult to interpret. Furthermore, extraction-based workflows remove the spatial, cellular, and histological context needed to understand particle localization and potential biological impact. Together, these factors make in situ microplastic and nanoplastic analysis within tissue fundamentally different—and considerably more challenging—than the analysis of isolated particles collected from environmental samples such as water, soil, sediments, and air.
The challenge of detecting microplastics in tissue
Conventional analytical techniques each face important limitations when applied to tissue-based microplastic analysis. Traditional infrared methods, including FTIR microscopy and QCL-based techniques such as LDIR, provide robust chemical specificity but remain constrained by diffraction-limited spatial resolution, limiting their ability to detect and characterize many particles below approximately 10–20 μm. Raman microscopy offers higher spatial resolution but may be affected by fluorescence interference, intrinsically weak scattering efficiency, and longer acquisition times when analyzing biological specimens. Furthermore, endogenous biochemical components within tissue, including proteins, lipids, nucleic acids, and extracellular matrix constituents, can generate background signals that complicate the identification of small or low-abundance particles.
In addition, extraction-based workflows commonly employed in environmental microplastic studies remove tissue architecture and biological context, preventing direct assessment of particle localization, tissue interactions, and associated biological responses within intact biological systems.
A further consideration is the presence of chemically similar non-polymeric materials within biological and environmental samples. Endogenous lipids, fatty acids, and common additives such as stearates contain hydrocarbon-rich chemical structures that may exhibit spectral features resembling those of certain polymer classes, particularly within the C–H stretching region. This challenge becomes especially important when analyzing very small particles within lipid-rich tissues such as liver, adipose tissue, and gastrointestinal samples, where low-abundance or partially embedded particles may generate mixed particle–tissue spectra. Consequently, approaches based on a limited number of diagnostic bands can result in ambiguous assignments, highlighting the importance of comprehensive spectral fingerprinting for reliable particle identification.
By combining submicron spatial resolution with full mid-infrared spectral fingerprinting, O-PTIR enables discrimination between true polymer particles and chemically similar biological or environmental materials. This comprehensive spectral approach reduces reliance on single-band detection strategies and provides greater confidence when identifying microplastics and nanoplastics within complex tissue environments.
Why chemical fingerprinting matters
Consider a small 1–2 μm inclusion detected within a lipid-rich tissue such as liver or adipose tissue. If identification is based on only a limited number of spectral bands, hydrocarbon-rich biological materials, fatty acids, or common additives such as stearates may exhibit features that resemble those of certain polymer classes. This challenge becomes increasingly important as particle size decreases and spectra become weaker or more strongly influenced by the surrounding tissue environment. In these cases, comprehensive spectral fingerprinting provides greater confidence than single-band or limited-feature approaches alone. O-PTIR combines submicron spatial resolution, full mid-infrared spectral fingerprinting, and optional simultaneous Raman analysis, enabling high-confidence identification of microplastics and nanoplastics within complex biological environments while preserving tissue architecture and spatial context.Why O-PTIR for tissue-based microplastics analysis
Optical Photothermal Infrared (O-PTIR) spectroscopy is a label-free chemical imaging technique that combines the chemical specificity of mid-infrared spectroscopy with spatial resolution beyond the diffraction limit of conventional FTIR microscopy.
O-PTIR detects the local photothermal response generated when a material absorbs pulsed mid-infrared light. In practice, a tunable mid-IR laser is used to excite molecular vibrations within the sample, causing extremely small localized thermal expansions at absorbing regions. (Figure 1).
A short-wavelength visible probe laser is then used to detect these photothermal changes with submicron precision. Because the spatial resolution is determined by the visible probe beam rather than the infrared wavelength itself, O-PTIR can achieve spatial resolution on the order of ~500 nm while still retaining full mid-infrared chemical information. This enables the detection and chemical characterization of particles well below the diffraction limits of conventional infrared microscopy, including particles approaching the sub-300 nm size range.

In addition, O-PTIR can be combined with simultaneous Raman spectroscopy, allowing complementary vibrational information to be collected at the same time, from the same spot with the same spatial location. Together, these capabilities enable highly specific identification of polymeric materials within biologically complex environments while preserving tissue architecture and spatial context. (Figure 1).

Moreover, O-PTIR can be combined with co-located fluorescence imaging (Figure 2) with chemically specific O-PTIR analysis at the same spatial location, enabling direct correlation between particle chemistry and biological markers or tissue structures. This supports targeted investigation of particle localization, uptake pathways, inflammatory response, and cellular interactions while reducing ambiguity in complex biological samples.
These capabilities make multi-modal O-PTIR particularly valuable for analyzing heterogeneous biological specimens where small particles, mixed signals, and complex tissue backgrounds present major analytical challenges. The technique enables direct chemical imaging and spectral identification of microplastics embedded within intact tissue without the need for fluorescent labels, particle extraction, or destructive digestion workflows.
Importantly, O-PTIR supports adaptive interpretation workflows where direct library matching alone may be insufficient. Depending on spectral overlap and signal quality, analysis can incorporate ratio imaging, background subtraction, spectral fitting, spectral unmixing, and multimodal correlation approaches to improve confidence when analyzing weak or mixed signals within heterogeneous tissue environments.
A more detailed description of O-PTIR can be found here.
Key capabilities include:
- Submicron infrared imaging and chemical mapping (~500 nm spatial resolution with detection capabilities extending into the sub-300 nm size range)
- Direct in situ identification of microplastics and nanoplastics within intact tissue
- Preservation of tissue architecture, cellular context, and particle localization
- Non-destructive analysis compatible with histology, fluorescence microscopy, and other multimodal workflows
- Adaptive interpretation strategies for mixed particle–tissue spectra and overlapping chemical signatures
- Simultaneous Raman and O-PTIR analysis from the exact same spatial location
- Quantitative particle detection, localization, and spatial mapping
- Integration with correlative, multimodal, and spatial biology workflows
- Simultaneous assessment of particle chemistry and surrounding tissue biochemistry to support toxicology and biological impact studies
Case study: In situ identification of embedded microplastics in tissue
Overview
To demonstrate the capability of O-PTIR for detecting and chemically identifying microplastics within intact biological matrices, a formalin-fixed tissue section containing embedded synthetic particles was analyzed using a combination of optical imaging, full spectral O-PTIR acquisition, single-frequency chemical mapping, and spectral library matching.
This case study demonstrates how O-PTIR enables:
- Detection of anomalous spectral signatures within native tissue
- Definitive polymer identification through IR spectral library matching
- Spatial mapping of microplastic distribution within intact histological architecture
- Submicron imaging resolution suitable for nanoplastics-scale analysis
A) Optical identification of suspicious domains
Initial 10× optical imaging revealed discrete domains within the tissue that were morphologically indistinguishable from surrounding structures. However, point O-PTIR spectra collected from these regions displayed prominent peaks at approximately 1219 cm⁻¹ and 1159 cm⁻¹, which are not characteristic of typical protein-, lipid-, or nucleic acid-rich biological tissue.
Comparison spectra acquired from adjacent tissue regions lacked these features and instead showed dominant amide I (~1660 cm⁻¹) and amide II (~1550 cm⁻¹) bands consistent with protein-rich tissue.
These unexpected peaks suggested the presence of an exogenous polymeric material embedded within the tissue section.


B) Library confirmation
Automated KnowItAll IR database matching identified the material as PTFE (Teflon) with high confidence.
Full O-PTIR spectra acquired from the anomalous domains were searched against a comprehensive infrared spectral database (KnowItAll IR). The material was identified as polytetrafluoroethylene (PTFE; Teflon®) with high confidence.
The diagnostic bands at ~1219 cm⁻¹ and ~1159 cm⁻¹ correspond to characteristic C–F stretching modes of PTFE, clearly differentiating the embedded particle from surrounding biological material.
This demonstrates a key advantage of O-PTIR: definitive chemical identification based on full mid-infrared spectral fingerprints rather than morphological inference or fluorescence staining.
Importantly, the observed PTFE bands lacked overlapping amide I/II or lipid carbonyl features, reducing the likelihood of common biological false-positive interferences outlined in Appendix B.

C) Single-frequency chemical mapping of polymer distribution
Single-frequency O-PTIR imaging at 1213 cm⁻¹ reveals the spatial distribution of PTFE domains within intact tissue. Discrete polymer regions as small as ~1 µm were resolved directly within the native biological matrix.
Following polymer identification, single-frequency O-PTIR imaging was performed at 1213 cm-1, corresponding to a strong PTFE absorption band. Because only a single diagnostic wavenumber was required, chemical mapping could be completed in minutes while maintaining submicron spatial resolution.
The resulting chemical map revealed the spatial distribution of PTFE domains embedded within the intact tissue section. Discrete regions as small as ~1 μm were clearly resolved, confirming that O-PTIR can rapidly detect and localize micron-scale polymer inclusions directly within complex biological specimens.
Importantly, no particle extraction, digestion, or matrix removal was required. The tissue architecture remained intact, enabling subsequent histological or fluorescence-based analysis if desired.

Key outcomes
This case study demonstrates that O-PTIR enables:- Detection of embedded microplastics directly within intact tissue sections
- Polymer identification through full mid-infrared spectral fingerprinting
- Submicron spatial mapping of particle localization and distribution
- Enhanced particle visualization using chemically selective ratio imaging
Together, these capabilities provide a comprehensive workflow for identifying, mapping, and characterizing microplastics within complex biological tissues while preserving histological context.
Case study: O-PTIR analysis of unknown particulate material in hip replacement tissue
To demonstrate the application of O-PTIR to clinically relevant tissue specimens, a separate case study was performed using periprosthetic tissue from a hip replacement patient. The tissue contained unknown particulate material embedded within a complex biological matrix.
This case study illustrates how O-PTIR can be used to localize, image, and chemically assess unknown particles directly within intact tissue sections, without requiring extraction or loss of spatial context.
A) Submicron O-PTIR imaging of unknown particulate material
Initial O-PTIR spectra were acquired from the particulate material and adjacent tissue regions to identify spectral bands providing the greatest chemical contrast. Enhanced absorbance was observed near 2920 cm-1, corresponding to aliphatic C–H stretching vibrations, and this band was selected for subsequent high-resolution imaging.
Importantly, identification of the particulate material was based on the complete O-PTIR spectrum rather than the 2920 cm-1 band alone. The spectra exhibited characteristic polyethylene-like hydrocarbon features, including strong CH2 stretching and bending bands, while lacking the prominent lipid carbonyl band typically observed near 1740 cm-1. Together, these spectral characteristics support assignment of the material as polyethylene rather than lipid-rich biological structures.

O-PTIR imaging was performed at 2920 cm-1, corresponding to the C–H stretching region, using a 250 nm step size. This enabled high-spatial-resolution chemical imaging of particle-associated signal within the tissue.
The resulting images revealed localized particle-associated signals and chemically heterogeneous particulate structures within the tissue. The use of a 250 nm imaging step size enabled detailed spatial mapping of the particulate material, providing substantially higher spatial sampling than conventional diffraction-limited FTIR microscopy. This capability is particularly important for assessing small particles and debris that may be localized within defined tissue regions.
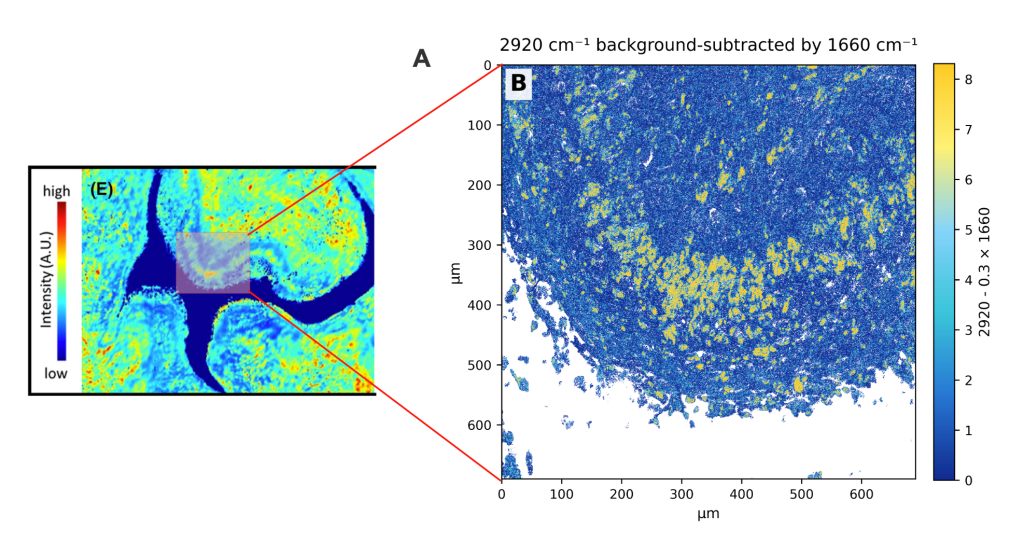
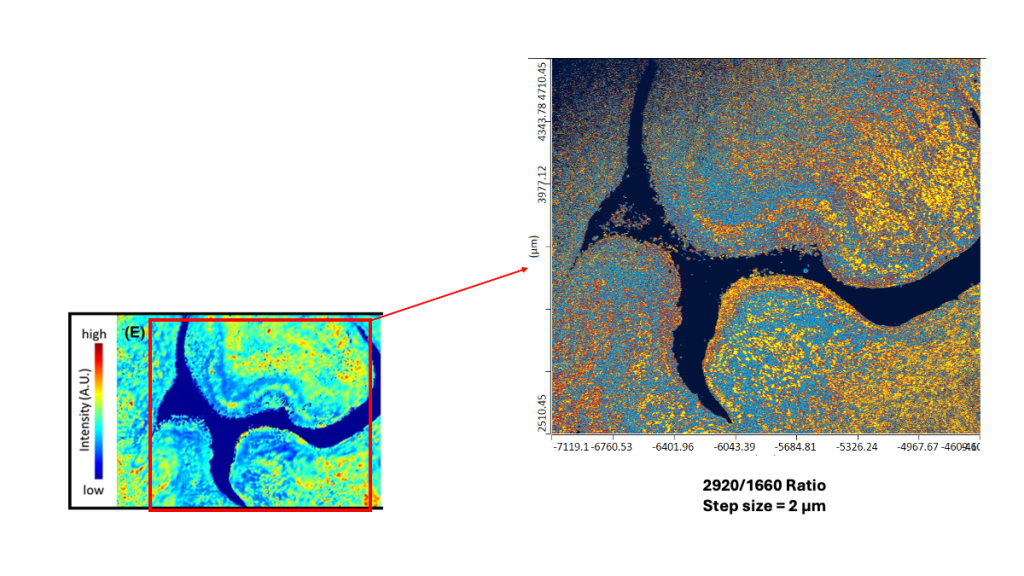
B) Ratio imaging for particle contrast enhancement
To enhance particle contrast relative to the surrounding protein-rich tissue matrix, ratio imaging was performed using chemically informative wavenumber ratios:
- 2920 cm⁻¹ / 1660 cm⁻¹, representing aliphatic C–H signal relative to protein amide I
- 1080 cm⁻¹ / 1660 cm⁻¹, representing fingerprint-region contrast relative to protein background
Ratio imaging suppressed native tissue signal while enhancing chemically distinct particulate regions. This improved visualization of particle boundaries and helped distinguish embedded particulate material from surrounding biological structures.
This workflow provides a useful strategy for investigating unknown particles, microplastic-like material, implant wear debris, and other exogenous materials in tissue while preserving spatial and histological context.
Key outcomes
This case study demonstrates that O-PTIR enables:- Detection and visualization of unknown particulate material directly within periprosthetic tissue
- Submicron chemical imaging of particle morphology and spatial distribution
- Enhanced particle-to-tissue contrast through targeted ratio imaging approaches
- Preservation of spatial and biological context without particle extraction or isolation
These results highlight the potential of O-PTIR for investigating implant wear debris, environmental contaminants, microplastic-like particles, and other exogenous materials within clinically relevant tissue specimens.
Advanced O-PTIR workflow for microplastics and nanoplastics in complex tissue samples

Advantages of O-PTIR over alternative methods
Comparison with existing techniques
| Method | Spatial Resolution | Chemical Specificity | Sample Preparation | Glass / Substrate Compatibility | Throughput | Limitations for Nanoplastics | O-PTIR Advantage |
|---|---|---|---|---|---|---|---|
| O-PTIR Microscopy | ~500 nm spatial resolution; demonstrated detection and chemical characterization of particles approaching the sub-300 nm size range | High (full IR spectra; simultaneous Raman optional) | Low (minimal preparation; compatible with tissue workflows) | Compatible with glass, CaF₂, silicon, metal-coated slides, and common microscopy substrates | Moderate–High (targeted ROI analysis typically completed within minutes) | Targeted analysis may require ROI selection for very large tissue areas | Unique combination of submicron IR imaging, direct chemical identification, intact tissue compatibility, and broad substrate flexibility |
| FTIR Microscopy | ~10-20 μm (diffraction-limited) | High (full IR spectra) | Low (thin sections) | Requires IR-transparent substrates (CaF₂, BaF₂, ZnSe); glass generally incompatible | Moderate | Diffraction-limited spatial resolution restricts detection and characterization of many particles below ~5–10 μm, making nanoplastic analysis challenging. | Submicron IR imaging; compatible with standard glass slides |
| nano-FTIR (s-SNOM-based infrared microscopy) | ~10–30 nm | High | High (specialized substrates, flat surfaces, and careful sample preparation often required) | Specialized substrates and highly flat sample surfaces often required | Very Low | Exceptional nanoscale resolution but limited field of view, low throughput, and impractical for large-scale tissue screening. | Greater area coverage, higher throughput, and compatibility with routine biological sample preparation workflows |
| Raman Microscopy | ~300–500 nm (confocal, wavelength-dependent) | High (Raman spectra) | Low (minimal prep) | Broad compatibility; glass background or fluorescence may interfere depending on wavelength | Low (slow) | Fluorescence interference; slow large-area mapping; endogenous lipid-rich tissue components may generate Raman features that overlap with common polymer signatures, complicating identification of small or low-abundance particles. | O-PTIR is unaffected by fluorescence background while simultaneous Raman acquisition provides complementary molecular confirmation from the exact same spatial location. |
| Py-GC/MS | No spatial info | Very High (polymer identification and quantification) | High (extraction required) | Not substrate dependent (particles extracted prior to analysis) | Moderate | Destructive; no imaging; loses biological context | Non-destructive; preserves spatial context & architecture |
| (Nile Red) Fluorescence Imaging | Microscopy-dependent (~200–300 nm for confocal imaging) | None (fluorescence) | Low–Moderate (staining, incubation, and washing workflow required) | Compatible with standard microscopy slides and fluorescence imaging substrates | High (rapid imaging) | False positives from lipids; false negatives from non-fluorescent plastics | Definitive chemical identification and localization; Nile Red can be used for rapid screening, with O-PTIR providing confirmatory chemical analysis. |
Key differentiators
O-PTIR uniquely combines submicron spatial resolution with full mid-infrared chemical specificity, enabling detection and identification of small embedded particles within biologically complex tissue environments. Unlike conventional extraction-based approaches, O-PTIR performs in situ analysis within intact tissue sections while preserving spatial relationships between particles and surrounding biological structures. Because O-PTIR measures the complete chemical composition of both particles and surrounding tissue, it can also provide insights into local biochemical changes and potential particle-associated biological responses.
Submicron IR chemical imaging
By overcoming the diffraction limitations of conventional FTIR microscopy, O-PTIR enables localization and analysis of micron- and submicron-scale particles directly within heterogeneous biological specimens.
Simultaneous Raman correlation
The ability to acquire simultaneous Raman and O-PTIR measurements from the same spatial location further improves analytical confidence by providing complementary vibrational information and reducing the likelihood of false positives.
Co-located Fluorescence + O-PTIR
Combines fluorescence imaging with chemically specific O-PTIR analysis at the same spatial location, enabling direct correlation between particle chemistry and biological markers or tissue structures. This supports targeted investigation of particle localization, uptake pathways, inflammatory response, and cellular interactions while reducing ambiguity in complex biological samples.
Biochemical tissue characterization
Unlike particle-centric analytical techniques, O-PTIR provides chemically specific information from both the particle and the surrounding biological microenvironment. In addition to identifying microplastics and nanoplastics, O-PTIR can characterize local biochemical composition, including proteins, lipids, nucleic acids, and extracellular matrix components within adjacent tissue regions.
This enables investigation of potential particle-associated biological responses such as lipid accumulation, inflammatory changes, fibrosis, tissue remodeling, and other biochemical alterations. By combining particle identification with spatially resolved tissue chemistry, O-PTIR supports a more comprehensive understanding of particle–tissue interactions and the potential biological impact of microplastics and nanoplastics.
Non-destructive multimodal compatibility
Because the technique is non-destructive, samples can subsequently be re-analyzed or integrated into downstream correlative imaging studies including histology, fluorescence microscopy, and immunohistochemistry.
Adaptive interpretation strategies
O-PTIR supports adaptive interpretation workflows tailored to sample complexity. Depending on spectral overlap and signal quality, analysis can incorporate spectral fitting, ratio imaging, background subtraction, and multimodal correlation approaches to improve confidence when analyzing heterogeneous biological specimens.
Key takeaways
Tissue-based microplastics analysis requires more than simple particle detection. Biological samples introduce complex spectral backgrounds, mixed signals, and heterogeneous microenvironments that can complicate reliable polymer identification. O-PTIR addresses these challenges by combining chemically specific infrared spectroscopy with submicron imaging capability, enabling confident localization and interpretation of embedded particles within complex biological tissue architecture. By preserving biological context, the technique enables researchers to move beyond isolated particle identification toward investigating particle distribution, tissue interactions, and potential biological effects. This includes correlation with inflammatory regions, structural features, and other pathological characteristics within the tissue microenvironment.
Importantly, O-PTIR supports confidence-based interpretation through integration of spectral evidence, spatial coherence, and multimodal validation approaches.
Conclusion
O-PTIR provides a powerful framework for the detection and identification of microplastics within biologically complex tissue environments. By combining submicron spatial resolution with chemically specific mid-infrared spectroscopy, the technique enables in situ localization and confirmation of embedded particles while preserving tissue architecture and biological context. Adaptive interpretation strategies including ratio imaging, spectral fitting, background subtraction, and multimodal Raman correlation further improve confidence when analyzing weak or overlapping signals within heterogeneous specimens.
Importantly, O-PTIR extends microplastics analysis beyond simple particle detection. Preservation of tissue structure enables correlation between particle localization and biological features such as inflammation, tissue morphology, cellular architecture, and pathological regions. This creates opportunities to investigate mechanisms of particle accumulation, transport, and biological interaction directly within intact specimens.
As multimodal imaging, spatial biology, and computational pathology continue to evolve, analytical techniques capable of integrating chemical specificity with spatially resolved biological information will become increasingly important. In this context, O-PTIR provides a label-free and chemically specific platform capable of supporting both exploratory research and advanced multimodal tissue workflows. By integrating high-resolution infrared imaging with spatially resolved chemical identification, the technique offers a robust and scalable approach for investigating microplastics and nanoplastics within real biological systems.
Appendix A: Common polymer O-PTIR fingerprints
| Polymer | Key O-PTIR Bands (cm⁻¹) |
|---|---|
| Polyethylene (PE) | C-H stretch: 2916, 2848 | CH₂ bend: 1472 | Rocking: 730, 719 |
| Polypropylene (PP) | C-H: 2950, 2920, 2865 | CH₃ bend: 1460, 1376 | C-C: 1167, 973 |
| Polystyrene (PS) | Aromatic C-H: 3060, 3025 | C-H: 2920, 2850 | C=C: 1601, 1493, 1452 | oop: 756, 698 |
| Polyethylene Terephthalate (PET) | C=O: 1720 | Aromatic C=C: 1615, 1578 | C-O: 1240, 1095 | Aromatic C-H: 730 |
| Polyvinyl Chloride (PVC) | C-H: 2920, 2850 | Bend: 1430 | C-Cl: 680–600 |
| PMMA | C=O: 1730 | C-O: 1240, 1190, 1150 | C-H: 2950 |
| Polyamide/Nylon (PA) | N-H: 3300 | Amide I: 1640 | Amide II: 1550 | C-H: 2920, 2850 |
| Polycarbonate (PC) | C=O: 1770 | Aromatic: 1600, 1505 | C-O: 1230, 1160 |
| Polytetrafluoroethylene (PTFE, Teflon) | C-F asym: 1210–1220 | C-F sym: 1145–1160 | CF₂ bend: 640 | deformation: 555–560 |


Appendix B: distinguishing plastics from biological materials - common spectral interferences & how O-PTIR resolves them
| Biological Material | Potential Interference | How to Distinguish |
|---|---|---|
| Lipid Droplets | C-H stretching (2920, 2850 cm⁻¹) similar to PE/PP | Lipids: Strong C=O at 1740 cm⁻¹, glycerol C-O bands at 1170, 1100 cm⁻¹. PE/PP: No C=O, no glycerol bands. Raman: Lipids show C=C stretching (~1650 cm⁻¹ unsaturated), PE/PP lack this. |
| Protein Aggregates | Amide bands can resemble polyamides (nylon) | Proteins: Amide I at 1650 cm⁻¹ (α-helix) or 1630 cm⁻¹ (β-sheet), Amide II at 1550 cm⁻¹, broad N-H at 3280 cm⁻¹. Polyamide: Amide I at 1640 cm⁻¹, sharper bands. Raman: Proteins show phenylalanine band at 1003 cm⁻¹. |
| Cellulose (Plant Material) | C-H and C-O bands overlap with some plastics | Cellulose: Strong, broad O-H at 3300 cm⁻¹, C-O-C at 1160, 1110, 1060, 1030 cm⁻¹ (multiple sharp peaks). Plastics: Different C-O patterns. Raman: Cellulose has characteristic band at 1095 cm⁻¹. |
| Starch | Similar to cellulose; C-H and C-O bands | Starch: O-H stretch, multiple C-O peaks (1150, 1080, 1020 cm⁻¹), water absorption. Plastics: Different spectral pattern in fingerprint region. |
| DNA/RNA | Phosphate and nucleic acid bands | Nucleic acids: Phosphate asymmetric stretch (1240 cm⁻¹), symmetric (1080 cm⁻¹), C=O/C=N at 1660 cm⁻¹. Plastics: No phosphate bands. |
| Chitin (Exoskeletons) | N-acetyl groups, polysaccharide structure | Chitin: Amide I (1660 cm⁻¹), Amide II (1550 cm⁻¹), C-O-C (1155, 1115, 1070 cm⁻¹), different from plastics. |
| Minerals (CaCO₃, Silicates) | Can show sharp IR bands | Minerals: CaCO₃ shows carbonate bands (1420, 875 cm⁻¹), silicates show Si-O (1000-1100 cm⁻¹). Plastics: Organic C-H bands absent in minerals. |
Interested in learning more?
Discover how O-PTIR technology enables submicron chemical imaging and multimodal analysis for microplastics and nanoplastics research in biological systems.
Publications
Method for label-free & non-destructive detection of microplastics in human formalin-fixed paraffin-embedded tissue sections
First Author: Elisabeth S. Gruber, Department of General Surgery, Medical University Vienna, Austria
Scientific Reports 15, 42637 (2025). doi: 10.1038/s41598-025-26751-1
Polystyrene nanoplastic exposure promotes amyloid misfolding and metabolic impairment at sub-lethal doses. A subcellular infrared imaging study
First Author: Iran Augusto Neves da Silva, Lund University, Sweden
Environmental Science: Nano 13, 1948–1961 (2026). doi: 10.1039/D5EN01181G
Label-free non-destructive spectroscopic detection of mixed microplastic uptake and differential effects on intestinal epithelial cells
First Author: Charlotte E. Sofield, University of Notre Dame Australia and Curtin University.
Journal of Hazardous Materials 504, 141283 (2026). doi: 10.1016/j.jhazmat.2026.141283
Label-free identification and imaging of microplastic and nanoplastic biouptake using optical photothermal infrared microspectroscopy.
First Author: Jun-Ray Macairan, Department of Chemical Engineering, McGill University
Environmental Science & Technology 59(30), 15612–15622 (2025). doi.doi.1021.est.4c14367
Advancing microplastic characterization in environmental samples using optical photothermal infrared (O-PTIR) spectroscopy
First Author: Moayad Yacoub, School of Earth, Environment, & Sustainability, Ball State University, USA
Environmental Geochemistry and Health 48, 279 (2026). doi.1007/s10653-026-03158-z
Optical photothermal infrared spectroscopy with simultaneously acquired Raman spectroscopy for two-dimensional microplastic identification
First Author: Julia Sophie Böke et al, Leibniz Institute of Photonic Technology
Scientific Reports 12, 18785 (2022). doi: 10.1038/s41598-022-23318-2
Webinars
- Life Science | Microplastics

- May 28, 2026
- Life Science | Microplastics
- April 1, 2026
- Life Science | Microplastics

- March 19, 2026
- Microplastics

- July 23, 2025
- Microplastics
- June 18, 2025
- Life Science | Microplastics

- June 26, 2025
Need more information?
Discover how O-PTIR technology can elevate your research or help solve your toughest challenges. Our team are happy to assist and answer your questions.