
Life Science
Bacteria & Microbiology
Simultaneous, submicron IR (O-PTIR) and Raman spectroscopy and imaging of individual bacterial cells
O-PTIR and Raman imaging of bacteria
O-PTIR spectroscopy represents a breakthrough in microbiology, enabling label-free chemical imaging and spectroscopic measurements of bacteria, fungi, and microbial communities at spatial resolutions far beyond conventional FTIR microscopy. This transformative technology provides direct insight into cell composition, metabolic states, and biochemical heterogeneity at the single-cell level – capabilities that were previously impossible with traditional infrared techniques.”
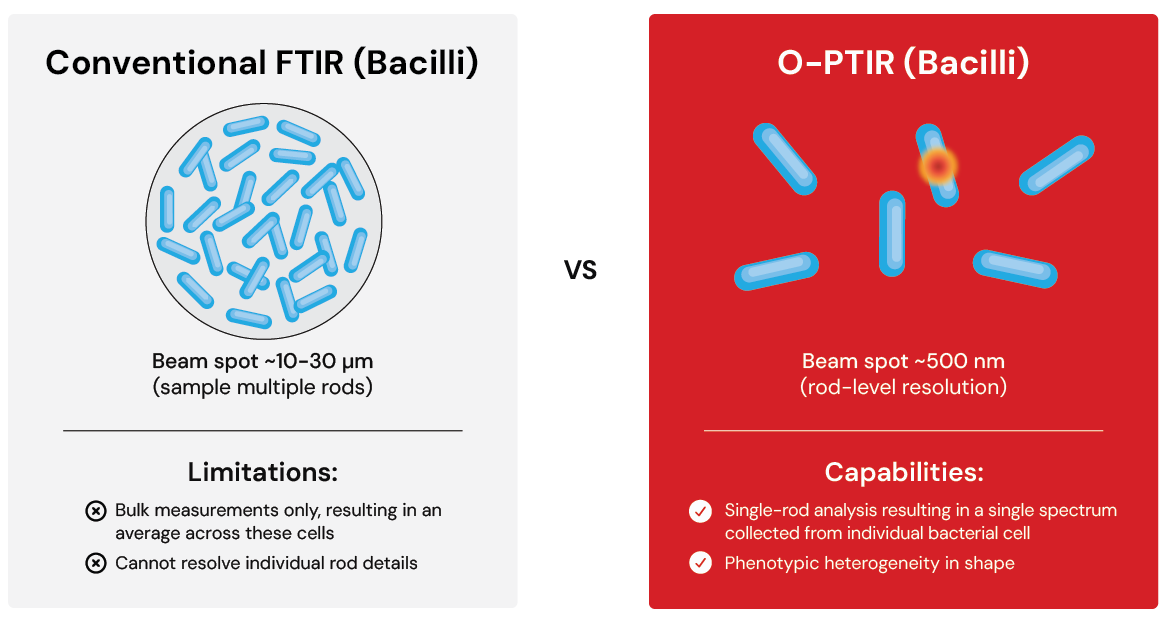
By overcoming the diffraction-limited spatial resolution of conventional FTIR (~10-20 μm), O-PTIR achieves sub-500 nm resolution, making it possible to characterize individual bacterial cells (typically 1-2 μm) with rich chemical information. The technique works by detecting the photothermal response when infrared radiation is absorbed using a visible probe laser, thus providing visible optical spatial resolution while maintaining the chemical specificity of infrared spectroscopy.
Raman microscopy has been widely applied to bacterial and microbial studies as a label-free technique for probing cellular biochemistry, including proteins, lipids, nucleic acids, pigments, and metabolic activity at sub-micron spatial resolution. Its high spatial resolution and molecular specificity make it valuable for single-cell analysis, microbial identification, and studies of biochemical heterogeneity within cells and communities.
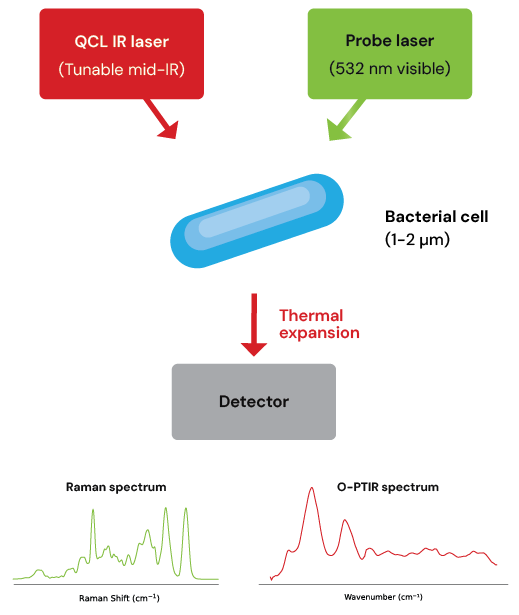
Key Innovation: O-PTIR uniquely combines the high spatial resolution of Raman microscopy with the rich chemical information content and sensitivity of infrared spectroscopy—delivering both protein-rich IR spectra and complementary Raman data, at the same point, time and resolution, from the same bacterial cell in seconds, without autofluorescence interference.
Why multimodal O-PTIR transforms microbial analysis
<500nm
spatial resolution
Clean
single cell spectrum
10's min
chemical image
1-2 μm
typical bacteria size
Key applications of multimodal microbial imaging
Single-Cell Bacterial Identification
Collect full IR and Raman spectra from individual bacterial cells, revealing phenotypic variations between cells of the same species that were previously undetectable with bulk FTIR methods.
Cell Wall Chemistry & Membrane Composition
Map the distribution of proteins, lipids, polysaccharides, and peptidoglycans within bacterial cell walls with submicron precision, essential for understanding antibiotic interactions.
e.g. Monitoring phenotype heterogeneity at the single-cell level within bacillus populations producing poly-3-hydroxybutyrate by label-free super-resolution infrared imaging Anal. Chem. 2023, 95, 48, 17733–17740
Biofilm Structure & EPS Mapping
Characterize biofilm architecture and map extracellular polymeric substances (EPS) distribution, critical for understanding bacterial communities and resistance mechanisms. e.g. Investigating Salmonella biofilm responses to antibiotic treatment using optical photothermal infrared spectroscopy Commun Biol 9, 405 (2026)
Antibiotic Response & AMR Detection
Monitor metabolic changes and phenotypic heterogeneity in response to antibiotic treatment, enabling rapid identification of antimicrobial resistance (AMR) at the single-cell level.
e.g. Optical Photothermal Infrared Spectroscopy: A novel solution for rapid identification of antimicrobial resistance at the single-cell level via deuterium isotope labeling
Front. Microbiol. 14:1077106 (2026)
Isotope Labeling & Metabolic Studies
Detect deuterium-labeled metabolites (²H, ¹³C) in single cells for metabolic fingerprinting, tracking nutrient uptake, and studying microbial community interactions.
e.g. Imaging isotopically labeled bacteria at the single-cell level using high-resolution Optical Infrared Photothermal Spectroscopy
Anal. Chem. 2021, 93, 6, 3082–3088 (2021)
Fungal Hyphae & Spore Chemistry
Analyze the chemical composition of fungal structures including hyphae networks, spores, and cell wall components with detailed spatial information.
e.g. Elucidating fungal decomposition of organic matter at sub-micrometer spatial scales using optical photothermal infrared (O-PTIR) microspectroscopy
Appl Environ Microbiol90:e01489-23 (2024)
Research highlights
Single bacterial cell O-PTIR microscopy with Deuterium-labelled E. coli
This groundbreaking study demonstrates O-PTIR’s capability to collect high-quality IR spectra from individual bacterial cells with dimensions of just 1-2 μm. The technique successfully detected deuterium incorporation, showcasing its potential for metabolic fingerprinting and tracking nutrient uptake in single cells.
- Spatial Resolution: ~500 nm spot size, enabling single-cell measurements
- Spectral Acquisition: 10 averaged spectra collected in ~15 seconds
- Chemical Imaging: Complete IR images at selected wavenumbers in ~1 minute
- Isotope Detection: Clear C-D signatures at 2195 cm⁻¹ and 2100 cm⁻¹
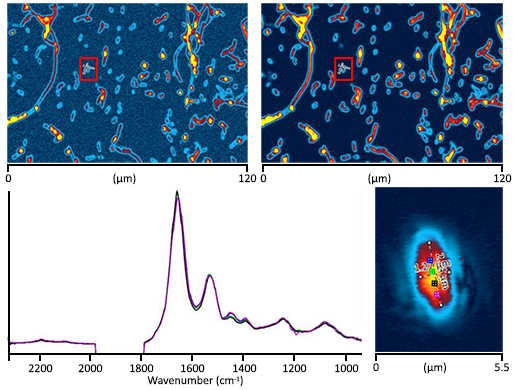
Top Left: O-PTIR image at 1655cm⁻¹ (protein) at 200nm step size. Image took 3 min to acquire each.
Top Right: O-PTIR image at 2195cm⁻¹ (C-D stretch) at 200nm step size. Image took 3 min to acquire each.
Bottom Left: Four submicron (~500nm spot) O-PTIR spectra were acquired from the single bacterial cell image above (Top Right), with corresponding colors. Spectra are normalized to 1655cm⁻¹. Each spectrum is 10 averages (~15 secs). You can see the C-D absorbances at around 2195cm⁻¹ and 2100cm⁻¹.
Bottom Right: Single E. coli cell (2.6×1.3 microns) imaged at 1655cm⁻¹ with 50nm steps. Image time, ~1 min.

Single bacterial cell simultaneous submicron IR+Raman Microscopy
Here, the clear complementarities of IR and Raman spectroscopy are evident, with the strong C-H stretching bands in the Raman (~2900cm⁻¹) being characteristically strong, whilst the IR spectra are very strong with their protein (~1600cm⁻¹) and other fingerprint range (1800-800cm⁻¹) signatures. The inherent sensitivity advantage of IR is also clear, with the O-PTIR spectrum demonstrating many times better sensitivity (SNR) over the Raman spectrum despite both measurements being the same time, ~20sec.
The simultaneous collection of both IR and Raman data from the exact same location on individual bacterial cells represents a unique capability of O-PTIR technology. This multimodal approach provides comprehensive chemical characterization that neither technique could achieve alone.
Key Insight: The complementarity between IR and Raman spectroscopy is fully exploited in O-PTIR. While IR provides exceptional sensitivity to proteins and water-associated changes, Raman excels at detecting lipids and C-H bonds. Together, they deliver a complete molecular picture of bacterial cells.
Bottom Left: Visible image of bacterial cells. Orange box indicates region of IR imaging.
Bottom Right: O-PTIR infrared image at 1655cm⁻¹, with 50nm step size. Collection time ~1 min.
Top: Simultaneous, submicron IR and Raman spectra collected from the indicated spot on the single bacterial cell in the IR image. Spectra are normalised to the most intense band spectra and are ~20sec accumulations. Raman spectra are baseline corrected.
Peer-reviewed research & validation
Recent peer-reviewed studies support the value of O-PTIR and complementary vibrational spectroscopy for microbiology, antimicrobial resistance (AMR), and single-cell biochemical analysis. Together, these publications reinforce the role of submicron IR and Raman workflows in bacterial identification, metabolic phenotyping, and spatially resolved microbiology.
O-PTIR imaging and spectroscopy of bacteria
PSC application content / bacterial single-cell O-PTIR and simultaneous IR + Raman
Demonstrates simultaneous submicron IR (O-PTIR) and Raman spectroscopy of individual bacterial cells, highlighting single-cell chemistry, isotope detection, and multimodal bacterial analysis.
- Supports single-cell bacterial analysis at submicron spatial resolution.
- Highlights simultaneous IR + Raman collection from the same bacterial cell.
- Connects bacterial imaging to AMR studies, metabolic fingerprinting, and biofilm analysis.
Deep learning-assisted Raman spectroscopy for rapid lactic acid bacteria identification at the colony level
Wang Y, Xu L, Shang L, et al. Spectrochimica Acta Part A: Molecular and Biomolecular Spectroscopy (2026)
This study combines in situ Raman spectroscopy with a Transformer-based deep learning model for rapid lactic acid bacteria classification at the colony level, directly addressing the challenge of colony heterogeneity during spectral acquisition.
- Reported classification accuracy of 98.2% across 14 lactic acid bacteria strains.
- Uses adaptive Raman acquisition to reduce the effects of colony heterogeneity.
- Shows how AI-enhanced vibrational spectroscopy can strengthen future O-PTIR-enabled microbial workflows.
Single-cell antimicrobial resistance detection using isotope labeling and O-PTIR
Shams S, Lima C, Xu Y, Ahmed SA, Goodacre R, Muhamadali H. Frontiers in Microbiology (2023)
This study demonstrates rapid identification of antimicrobial resistance at the single-cell level using deuterium isotope labeling and O-PTIR, providing a strong evidence base for metabolic-response-based AMR workflows.
- Supports the “Antibiotic Response & AMR Detection” application story.
- Provides a direct literature anchor for D2O-based single-cell AMR analysis.
- Useful for linking isotope incorporation, C–D signatures, and resistant versus susceptible phenotypes.
Biofilm metabolic heterogeneity and antibiotic response
Smaje D, et al. Communications Biology (2026)
Recent O-PTIR biofilm work shows that spatially resolved metabolic heterogeneity and antibiotic response can be visualized within intact microbial communities, supporting biofilm-focused chemical imaging and spatial microbiology workflows.
- Best used to strengthen the “Biofilm Structure & EPS Mapping” section.
- Reinforces microbial community ecology and AMR narratives.
- Shows that O-PTIR extends beyond single cells into structured communities and gradients.
Selected references
- Shams S, Lima C, Xu Y, Ahmed SA, Goodacre R, Muhamadali H. Optical photothermal infrared spectroscopy: A novel solution for rapid identification of antimicrobial resistance at the single-cell level via deuterium isotope labeling. Frontiers in Microbiology. 2023;14:1077106. DOI
- Lima C, Muhamadali H, Xu Y, Kansiz M, Goodacre R. Imaging isotopically labeled bacteria at the single-cell level using high-resolution optical infrared photothermal spectroscopy. Analytical Chemistry. 2021;93(8):3082–3088. DOI
- Smaje D, et al. Investigating Salmonella biofilm responses to antibiotic treatment using optical photothermal infrared spectroscopy. Communications Biology. 2026. DOI
- Prater CB, Kansiz M, Cheng J-X. A tutorial on optical photothermal infrared (O-PTIR) microscopy. APL Photonics. 2024;9(9). DOI
- Wang Y, Xu L, Shang L, Peng H, Liu K, Bao X, Tang X, Liang P, Wang Y, Zheng M, Li B. Deep learning-assisted Raman spectroscopy for rapid lactic acid bacteria identification at the colony level. Spectrochimica Acta Part A: Molecular and Biomolecular Spectroscopy. 2026;344(1):126662. DOI
Why O-PTIR for microbiology?
Technical advantages
- Simultaneous IR+Raman:
Same spot, same time, same ~500 nm resolution - Co-Located Fluorescence:
Same objective, immediate correlation - Perfect Registration:
All images inherently aligned—no optics or sample movement - Time Efficient:
Complete multimodal dataset in 10’s of minutes - No Artifacts: Single measurement eliminates registration errors
- Sample Preservation:
Non-destructive, label-free core measurements - Flexible Configuration:
Add Raman and/or fluorescence as needed
Scientific impact
- Phenotypic Heterogeneity:
Reveal cell-to-cell variations within clonal populations - Metabolic Fingerprinting:
Track deuterium or ¹³C-labeled metabolites in individual cells - AMR Studies:
Detect antibiotic response at single-cell level, identifying resistant subpopulations - Microbial Communities:
Map chemical gradients and cell-cell interactions in biofilms - Rapid Identification:
Classify bacteria without cultivation, directly from samples - No Labeling Required:
Preserve native biochemistry without fluorescent tags or stains
Request a demo!
Discover how multimodal O-PTIR can provide the comprehensive chemical picture your spatial biology research demands—and how it perfectly complements your existing spatial omics workflows.
O-PTIR vs. conventional FTIR for bacterial analysis
Typical O-PTIR microbiology workflow
From sample to insight
1. Sample Preparation
- Culture bacteria
- Optional: D₂O labeling
- Deposit on substrate
- Air dry or fix
2. O-PTIR Imaging
- Locate cells (visible)
- Chemical imaging
- Point spectra
- Optional: + Raman
3. Data Analysis
- PCA/DFA classification
- Spectral comparison
- Chemical mapping
- Statistical modeling
4. Results
- Species ID
- AMR status
- Metabolic state
- Phenotyping
Application-specific workflows
AMR Detection
- Culture in D₂O media
- Add antibiotic (e.g., TMP)
- Time series: 1h, 2h, 3h, 4h
- O-PTIR: C-D signatures
- PCA: Separate resistant/sensitive
Biofilm Structure
- Grow biofilm on substrate
- Gently wash & fix
- Chemical imaging (multiple λ)
- Map: proteins, EPS, lipids
- 3D chemical architecture
Metabolic Fingerprinting
- ¹³C or D₂O substrate
- Time-course incubation
- Single-cell O-PTIR spectra
- Quantify isotope incorporation
- Track metabolic activity
Typical timelines
Sample Prep
30 min - 24 hours
O-PTIR Measurement
Spectra and images in seconds
Analysis
Minutes to hours
Key Workflow Advantages
NMinimal cultivation mass required • Label-free detection • Multimodal capability • High throughput potential • Minimal sample prep
Research diagnostics
Antimicrobial Resistance (AMR)
Rapid detection of antibiotic-resistant bacteria using deuterium isotope probing and O-PTIR spectroscopy. Distinguish resistant and sensitive strains at single-cell level within hours, not days.
Microbial Community Ecology
Map chemical heterogeneity within biofilms and microbial consortia. Understand cell-cell interactions, nutrient gradients, and metabolic cooperation at unprecedented resolution.
Industrial Microbiology
Monitor fermentation processes, quality control of bacterial products, and detection of contamination. Real-time chemical phenotyping for process optimization.
Agricultural Microbiology
Characterize plant-associated bacteria, soil microorganisms, and plant pathogens. Study nitrogen-fixing bacteria and mycorrhizal associations.
Pathogen Identification
Rapid species-level identification of bacterial pathogens directly from clinical samples without cultivation. Build spectral libraries for automated classification.
Metabolic Engineering
Track engineered metabolic pathways using isotope labeling. Verify production of target molecules and identify metabolic bottlenecks at single-cell resolution.
Why O-PTIR for microbiology?
Chemical Maps
- Protein distribution: Amide I (1655 cm⁻¹), Amide II (1545 cm⁻¹)
- Lipid content: C-H stretching (3000-2800 cm⁻¹), C=O stretching (1740 cm⁻¹)
- Polysaccharides: C-O-C stretching (1150-1000 cm⁻¹)
- Nucleic acids: PO₂⁻ symmetric stretch (1080 cm⁻¹)
- Deuterium labels: C-D stretching (2300-2000 cm⁻¹)
Quantitative Data
- Single-cell spectra: Full mid-IR range with ~4-8 cm⁻¹ resolution
- Spectral databases: For bacterial classification and identification
- Statistical models: PCA, DFA, PLS for multivariate analysis
- Time-series data: Monitor dynamic responses to treatments
- Comparative datasets: Across strains, treatments, or conditions
Technical specifications for bacterial imaging
Spatial resolution
<500 nm lateral resolution
Enables single bacterial cell imaging
Spectral range
~3000-2700 cm⁻¹ (C-H region)
~2300-2000 cm⁻¹ (C-D/silent region)
~1800-800 cm⁻¹ (Fingerprint)
Acquisition speed
Seconds per spectrum
Seconds for chemical image
High throughput, automated capability
Sample requirements
Fixed or dried samples
Standard substrates: Glass, CaF₂
Minimal preparation needed
O-PTIR vs. other techniques for bacterial analysis
| Technique | Resolution | Single Cell | Label-Free | Chemical Info | Speed |
|---|---|---|---|---|---|
| O-PTIR | <500 nm | ✓ | ✓ | Rich (IR+Raman) | Very fast (sec-min) |
| FTIR | 10-20 µm | ✗ | ✓ | Rich (IR only) | Fast (10's sec - min) |
| Raman | <500 nm | ✓ | ✓ | Good | Slow (min-hr) |
| Fluorescence | ~200 nm | ✓ | ✗ | Limited | Very fast (secs) |
| AFM-IR | ~20 nm | ✓ | ✓ | Good | Very slow (hr) |
Note: O-PTIR uniquely combines submicron resolution, label-free operation, rich chemical information, and rapid acquisition—making it ideal for single bacterial cell analysis and high-throughput studies.
Webinars
- Life Science | Microplastics

- May 28, 2026
- Life Science | Microplastics
- April 1, 2026
- Life Science
- February 12, 2026
- Life Science
- November 13, 2025
- Life Science

- October 2, 2025
- Life Science | Microplastics

- June 26, 2025
Need more information?
Discover how O-PTIR technology can elevate your research or help solve your toughest challenges. Our team are happy to assist and answer your questions.